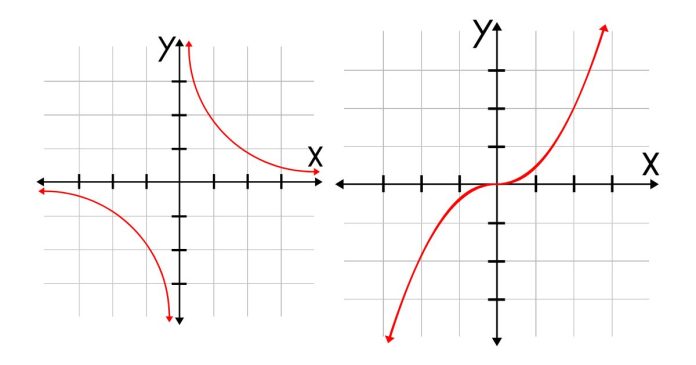
In the world of graphing functions, intercepts are key points where the graph crosses the axes. Understanding intercepts is crucial for analyzing and interpreting graphs of mathematical functions. There are two main types of intercepts: x-intercepts and y-intercepts.
- X-Intercept:
The x-intercept is the point where the graph crosses the x-axis. At this point, the value of the function (y) is zero. To find the x-intercept of a function, you set the value of y to 0 and solve for x. This tells you where the graph intersects the x-axis.
For example, for the function , you would set and solve for x:
2x – 4 = 0
2x = 4
x = 2
- Y-Intercept:
The y-intercept is the point where the graph crosses the y-axis. At this point, the value of x is zero. To find the y-intercept of a function, you set x = 0 and solve for y.
For example, using the same function , you would set and solve for y:
f(0) = 2(0) – 4
f(0) = -4
Importance of Intercepts
Intercepts help in understanding the basic structure of a function’s graph. They provide insight into where the function begins (y-intercept) and where it crosses the x-axis (x-intercept). These points are often used in graphing and solving real-world problems that involve linear or nonlinear relationships.
In summary, the intercepts of a function are essential for graphing and interpreting its behavior. The x-intercept is found by setting , and the y-intercept is found by setting . Understanding these points is a fundamental part of graphing and analyzing mathematical functions.


