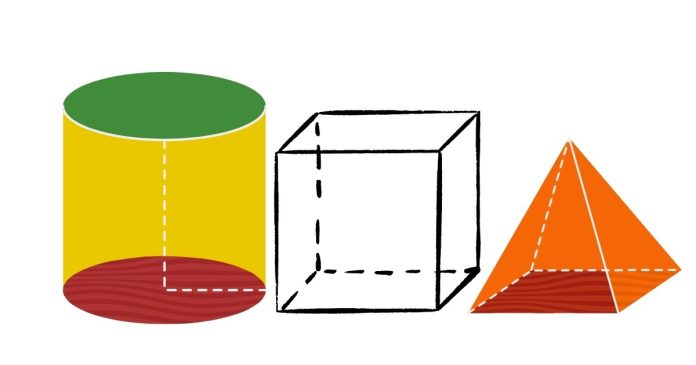
Three-dimensional plotting in Python can be done using the matplotlib library. The matplotlib.pyplot module provides functionality for creating various types of plots, and for 3D plotting, you need to use mpl_toolkits.mplot3d which is a toolkit for 3D plotting in matplotlib.
Steps to Create 3D Plots in Python:
- Import the Required Libraries: You will need
matplotlibandmpl_toolkits.mplot3dfor 3D plotting. - Create a Figure and a 3D Axes Object: Use
plt.figure()to create a new figure andfig.add_subplot(111, projection='3d')to create a 3D subplot. - Plot Data: Use various methods for plotting like
plot3D(),scatter(),plot_surface(), andplot_wireframe()depending on the plot you want. - Show the Plot: Use
plt.show()to display the plot.
Example Code:
Here are a few different types of 3D plots you can create.
1. 3D Line Plot:
import matplotlib.pyplot as plt
from mpl_toolkits.mplot3d import Axes3D
import numpy as np

# Generate data
x = np.linspace(-5, 5, 100)
y = np.sin(x)
z = np.cos(x)

# Create a figure and 3D axes object
fig = plt.figure()
ax = fig.add_subplot(111, projection='3d')

# Plot 3D line
ax.plot(x, y, z, label='3D line')
ax.set_xlabel('X Label')
ax.set_ylabel('Y Label')
ax.set_zlabel('Z Label')
ax.set_title('3D Line Plot')

# Show the plot
plt.show()
2. 3D Scatter Plot:
import matplotlib.pyplot as plt
from mpl_toolkits.mplot3d import Axes3D
import numpy as np

# Generate random data
x = np.random.rand(100)
y = np.random.rand(100)
z = np.random.rand(100)

# Create a figure and 3D axes object
fig = plt.figure()
ax = fig.add_subplot(111, projection='3d')

# Scatter plot
ax.scatter(x, y, z, c='r', marker='o')
ax.set_xlabel('X Label')
ax.set_ylabel('Y Label')
ax.set_zlabel('Z Label')
ax.set_title('3D Scatter Plot')

# Show the plot
plt.show()
3. 3D Surface Plot:
import matplotlib.pyplot as plt
from mpl_toolkits.mplot3d import Axes3D
import numpy as np

# Generate data
x = np.linspace(-5, 5, 100)
y = np.linspace(-5, 5, 100)
x, y = np.meshgrid(x, y)
z = np.sin(np.sqrt(x**2 + y**2))

# Create a figure and 3D axes object
fig = plt.figure()
ax = fig.add_subplot(111, projection='3d')

# Surface plot
ax.plot_surface(x, y, z, cmap='viridis')

# Labels and title
ax.set_xlabel('X Label')
ax.set_ylabel('Y Label')
ax.set_zlabel('Z Label')
ax.set_title('3D Surface Plot')

# Show the plot
plt.show()
4. 3D Wireframe Plot:
import matplotlib.pyplot as plt
from mpl_toolkits.mplot3d import Axes3D
import numpy as np

# Generate data
x = np.linspace(-5, 5, 100)
y = np.linspace(-5, 5, 100)
x, y = np.meshgrid(x, y)
z = np.sin(np.sqrt(x**2 + y**2))

# Create a figure and 3D axes object
fig = plt.figure()
ax = fig.add_subplot(111, projection='3d')

# Wireframe plot
ax.plot_wireframe(x, y, z, color='black')

# Labels and title
ax.set_xlabel('X Label')
ax.set_ylabel('Y Label')
ax.set_zlabel('Z Label')
ax.set_title('3D Wireframe Plot')

# Show the plot
plt.show()
Explanation of Key Methods:
plot(x, y, z): Creates a 3D line plot.scatter(x, y, z): Creates a 3D scatter plot.plot_surface(x, y, z): Creates a 3D surface plot.plot_wireframe(x, y, z): Creates a 3D wireframe plot.meshgrid: Generates a grid of points in 3D space for surface or wireframe plotting.
Customization:
- Color Maps (cmap): You can apply color maps such as
'viridis','plasma', etc., to the surfaces. - Labels: Use
set_xlabel(),set_ylabel(), andset_zlabel()to label the axes. - Titles: Use
set_title()to add a title to the plot.
With these methods, you can create various types of 3D plots in Python using Matplotlib.


